Chart shows how Brits have fallen out of love with the NHS: Satisfaction with ... trends now

Chart shows how Brits have fallen out of love with the NHS: Satisfaction with ... trends now

Chart shows how Brits have fallen out of love with the NHS: Satisfaction with ... trends now

Public satisfaction with the NHS has fallen to the lowest level on record amid poor access to GPs and long waits for hospital care. 

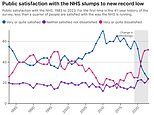
Fewer than one in four (24 per cent) people were happy with the health service in 2023, down 5 percentage points on the previous year alone. 

It is the lowest level since records began in 1983, according to latest findings from the British Social Attitudes Survey. 

The study, of 3,374 people in England, Wales and Scotland, is seen as the gold-standard test of how people feel about the NHS. 

It reveals more than half (52 per cent) are now dissatisfied with the NHS, the highest proportion since the survey began. 

The main reasons for dissatisfaction are waiting times for GP and hospital appointments (71 per cent), followed by staff shortages (54 per cent) and the Government not spending enough money on the NHS (47 per cent), despite record investment. 

Health think tanks said there had been an ‘unprecedented downward spiral’ in public satisfaction in recent years and warned political leaders should take note of the ‘depressing’ results ahead of the general election. 

Satisfaction with the NHS peaked in 2010, when 70 per cent of people were happy with the health service but it has since fallen. 

It has suffered a particularly rapid decline of 29 percentage points since 2020, when services were crippled by the Covid-19 pandemic. 

Strikes by nurses, junior doctors and consultants have also led to the widespread cancellation of operations and appointments over the past year. 

What do the latest NHS performance figures show?

The overall waiting list shrunk by 28,000 to 7.58million in January. 

There were 376 people waiting more than two years to start treatment at the end of January, up on the 282 in December. 

The number of people waiting more than a year to start hospital treatment was 321,394, down slightly on the 337,450 in the previous month.

Some 44,417 people had to wait more than 12 hours in A&E departments in England in February. The figure is down on the 54,308 logged in January.

A total of 139,458 people waited at least four hours from the decision to admit to admission in February, down from 158,721 in January. 

Just 70.9 per cent of patients were seen within four hours at A&Es last month. NHS standards set out that 95 per cent should be admitted, transferred or discharged within the four-hour window.

In February, the average category one response time – calls from people with life-threatening illnesses or injuries – was 8 minutes and 25 seconds. The target time is seven minutes.

Ambulances took an average of 36 minutes and 20 seconds to respond to category two calls, such as burns, epilepsy and strokes. This is more than twice as long as the 18 minute target.

Response times for category three calls – such as late stages of labour,

read more from dailymail.....

PREV Doctors thought my back pain was creaky joints... it was actually a golf ... trends now
NEXT What your cough could really mean, from THAT irritating 'dry' tickle to the ... trends now